The Trivy-Operator is a powerful tool that can help to improve the runtime security of your Kubernetes cluster by automatically scanning your container images for known vulnerabilities and validate your Kubernetes resources against best practices to ensure that your cluster is configured securely. The easy installation and smooth integration in your monitoring stack allows you to quickly make the Trivy-Operator to a core building block of your Kubernetes security strategy.
Table of Contents
What is Trivy?
Trivy is a simple and comprehensive vulnerability scanner for containers that is suitable for use in CI/CD environments. It is an open-source project primarily developed and maintained by Aqua Security. Usually, Trivy is used as a CLI tool that provides mechanisms for security scanning of container images, VM images, git repositories and Kubernetes clusters. With the Trivy CLI, you can scan these resources on your local machine or include security scanning in your CI/CD pipelines.
You can find more information in the official Trivy documentation.
Trivy-Operator – Leveraging the Operator Pattern
Operators are really awesome! 🙂 Explaining the capabilities of the Kubernetes operator pattern is worth a blog post for itself. In a nutshell: The Kubernetes operator pattern is a way of extending the functionality of the Kubernetes API to build and manage applications on Kubernetes using custom controllers and resources. It allows for automation of application-specific tasks (such as deployment and backups of certain resources) that require deep knowledge of the application itself and cannot be automated by Kubernetes out of the box.
The Trivy-Operator is leveraging the Kubernetes operator pattern. The official docs state: This operator automatically updates security report resources in response to workload and other changes on a Kubernetes cluster – for example, initiating a vulnerability scan and configuration audit when a new Pod is started. The following diagram (from the Trivy-Operator docs) gives a good overview of the components that make up the Trivy-Operator and how these components work together.
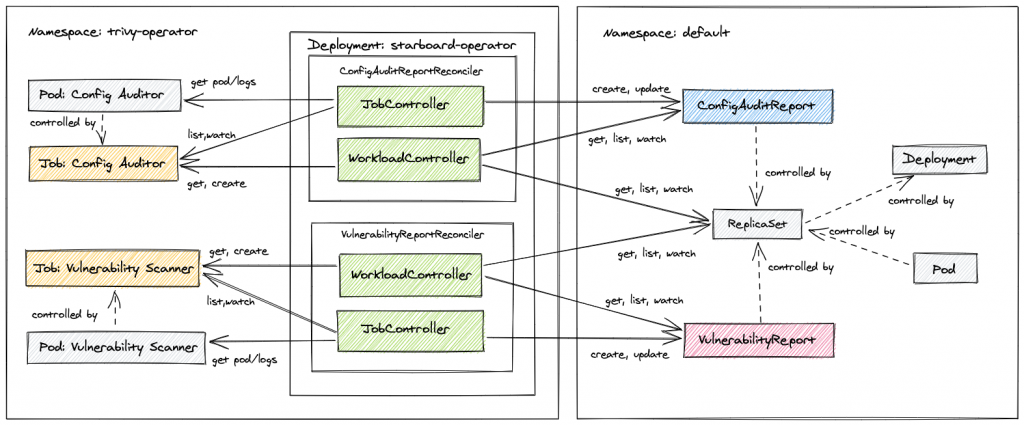
In other words, the Trivy-Operator is a deployment in your cluster that uses Kubernetes native mechanisms to generate and manage scan reports for other workload resources (pods, roles, etc.). These reports are also custom resources and easy accessible with kubectl.
Important: The Trivy-Operator is no replacement for the Trivy CLI!
As mentioned above, it is already possible to scan your Kubernetes cluster with the Trivy CLI. The real power of the Trivy-Operator is the usage of the event-based nature of Kubernetes resources. For example: Initiating a vulnerability scan when a new Pod is created and updating the scan report. Whereas the Trivy CLI has to be triggered imperative (manually or by a scheduled task in your pipeline). In summary, the Trivy-Operator is especially designed for the runtime security in your cluster, while the Trivy CLI is better suited within CI/CD pipelines during “build time”, before your container is deployed! So it makes totally sense to combine both tools when scanning your Kubernetes artifacts for vulnerabilities.
Deploying the Trivy-Operator in your cluster
The following commands and screenshot pertain to deploying the Trivy-Operator version 0.10.1. Please always check the official docs as the deployment and its parameters may change in future versions!
Deploying the Trivy-Operator with helm is really straightforward:
helm repo add aqua https://aquasecurity.github.io/helm-charts/
helm repo update

helm install trivy-operator aqua/trivy-operator \
  --namespace trivy-system \
  --create-namespace \
  --version 0.10.1
By running these commands, the Trivy-Operator will be installed with its default settings. I highly recommend to review the values.yaml file in order to make any necessary adjustments to these defaults settings. This is especially important for the following use cases:
- Air-gapped environments: If you are using custom image registries like Artifactory or Harbor it is necessary to update the paths for the container images and the vulnerability database.
image:
  repository: "artifactory.thomasroot.local/aquasecurity/trivy-operator"

trivy:
 # repository of the Trivy image
  repository: "artifactory.thomasroot.local/aquasecurity/aquasec/trivy"

  # Registries without SSL. There can be multiple registries with different keys.
  nonSslRegistries: {
    artifactory: "artifactory.thomasroot.local"
  }

  # The registry to which insecure connections are allowed. There can be multiple registries with different keys.
  insecureRegistries: {
    artifactory: "artifactory.thomasroot.local"
  }

# serverCustomHeaders is a comma separated list of custom HTTP headers sent by
  # Trivy client to Trivy server. Only applicable in ClientServer mode.
  #
  # serverCustomHeaders: "foo=bar"

  dbRepository: "artifactory.thomasroot.local/aquasecurity/trivy-db"

  # The Flag to enable insecure connection for downloading trivy-db via proxy (air-gaped env)
  # Customized because local artifactory repo is "insecure"
  dbRepositoryInsecure: "true"
- Exposing prometheus metrics: Enabling the
serviceMonitorflag allows for Prometheus scraping for the Trivy-Operator. However, it is important to note that Prometheus must already be installed before activating this setting. If you don’t do so it will result in the helm installation failing due to the missingCustomResourceDefinition(CRD)ServiceMonitor.
# Prometheus ServiceMonitor configuration -- to install the trivy operator with the ServiceMonitor
# you must have Prometheus already installed and running
serviceMonitor:
  # enabled determines whether a serviceMonitor should be deployed
  enabled: true
  # The namespace where Prometheus expects to find service monitors
  # namespace: ""
- Restricting and excluding resources: Useful when you don’t want to scan certain namespaces or workloads. This may be the case for system-specific resources that are part of your Kubernetes provider, such as Tanzu Kubernetes Grid by VMware.
# targetNamespace defines where you want trivy-operator to operate. By
# default, it's a blank string to select all namespaces, but you can specify
# another namespace, or a comma separated list of namespaces.
targetNamespaces: ""

# excludeNamespaces is a comma separated list of namespaces (or glob patterns)
# to be excluded from scanning. Only applicable in the all namespaces install
# mode, i.e. when the targetNamespaces values is a blank string.
excludeNamespaces: ""

# targetWorkloads is a comma seperated list of Kubernetes workload resources
# to be included in the vulnerability and config-audit scans
# if left blank, all workload resources will be scanned
targetWorkloads: "pod,replicaset,replicationcontroller,statefulset,daemonset,cronjob,job"
- Timeouts: In some cases it’s necessary to increase the
scanJobTimeoutwhich is by default 5m. For example, I have sometimes observed timeouts when scanning large deployments such as the kube-prometheus-stack in our environment.
operator:
  # scanJobTimeout the length of time to wait before giving up on a scan job
  scanJobTimeout: 5m
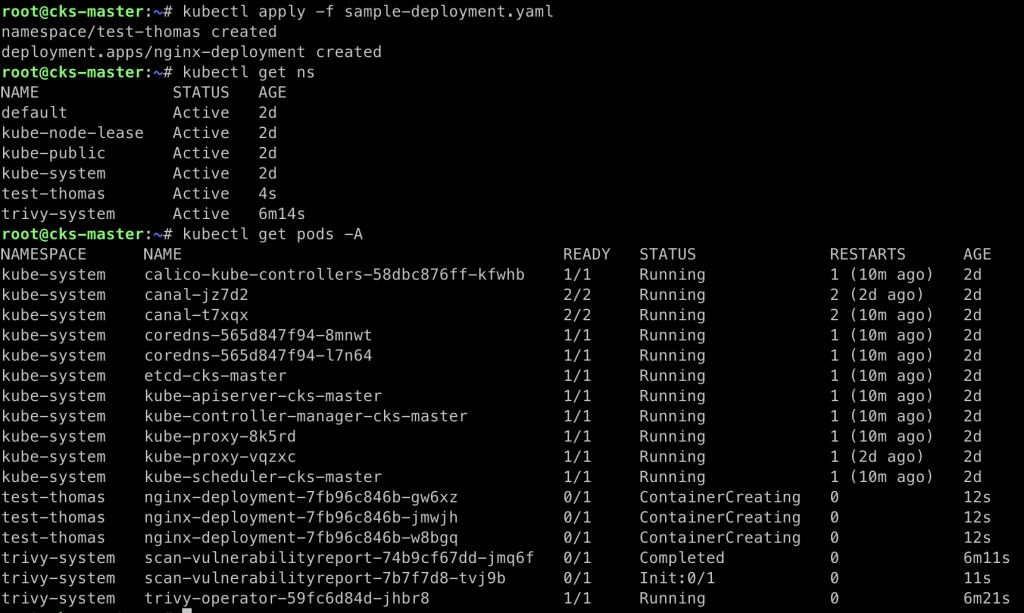
Immediately after installation, the Trivy-Operator begins scanning the resources in your cluster. The following screenshot shows a sample nginx deployment that has not been fully created, but the Trivy-Operator is already scanning it.
kubectl get clustercompliancereports
kubectl get clusterrbacassessmentreports
kubectl get rbacassessmentreports -A
kubectl get clusterconfigauditreports -A
kubectl get exposedsecretreports -A
kubectl get infraassessmentreports -A
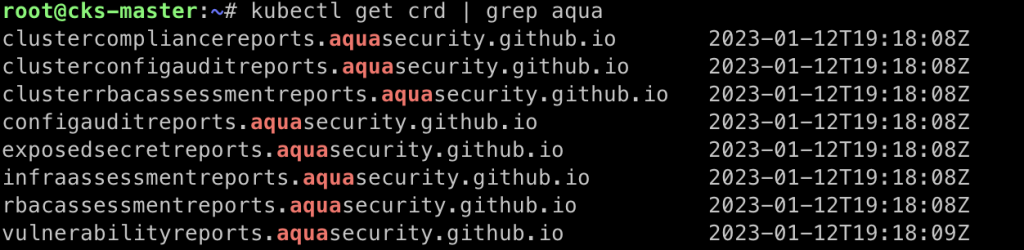
kubectl get vulnerabilityreports -AAs you can see the Trivy-Operator generates a bunch of reports that provide valuable information about the current security level of your cluster. The Trivy-Operator updates security reports automatically as the workload and other changes occur on your Kubernetes cluster. This results in the generation of the following reports (the inline-code indicates the Kubernetes resource name of the report):
clustercompliancereports: Creation of reports based on CIS benchmark and NSA Kubernetes Hardening Guidance.clusterrbacassessmentreports&rbacassessmentreports: Scans that provide detailed information on the access rights of different resources installed, and highlight any issues with excessive privileges forClusterRolesorRoles.clusterconfigauditreports: Automated configuration audits for Kubernetes resources with predefined rules or custom Open Policy Agent (OPA) policies.exposedsecretreports: Automated scans that locate and detail the location of exposed Secrets within your cluster.infraassessmentreports: Scans of Kubernetes core components (etcd, apiserver, scheduler, controller-manager, etc.) settings and configurations.vulnerabilityreports: Automated scans for vulnerabilities in container images.
Showing samples of all these reports would quite blow up this post. You can look up detailed examples of the reports in the official docs.
I highly recommend checking and remediating security issues of one scan report after another. You may start by reviewing the VulnerabilityReport and implementing a process for receiving notifications when new vulnerabilities are found in your container images. If you have setup such a process properly you can do same the for the next report. And so on…
Triggering Scan Reports
By default, the Trivy-Operator recreates vulnerability scan reports every 24 hours. The other reports might have a different schedule. However, these settings can be changed in the values.yaml file of the Helm chart. This means that all vulnerability scans are executed again daily and the scan is always executed using the latest vulnerability database. By the way, every scan report resource is associated with a built-in resource, and follows its lifecycle. The Trivy-Operator also uses Kubernetes garbage collector feature to automatically remove outdated reports and initiate new scans.
Additionally it’s also possible to manually recreate scan reports by deleting the existing report, which will trigger the Trivy-Operator to start a new scan job.
Integrations
So far, we have installed the Trivy-Operator in our cluster and it is continuously scanning our running containers for security issues and misconfigurations. However, it is likely that nobody will read these reports, as they are not being actively monitored! At least I won’t do that! 😁 Exactly for this purpose the Trivy-Operator offers a Prometheus metrics endpoint and a webhook intregration in order to establish a monitoring (especially for your production environments).
Integration with Prometheus, Grafana & Alertmanager
I already outlined the steps for enabling the metrics endpoint in this blog post in order to enable Prometheus scraping the Trivy-Operator’s metrics. Of course, you can integrate these metrics in your existing monitoring infrastructure. Otherwise you might have a look on the kube-prometheus-stack and deploy it to your cluster.
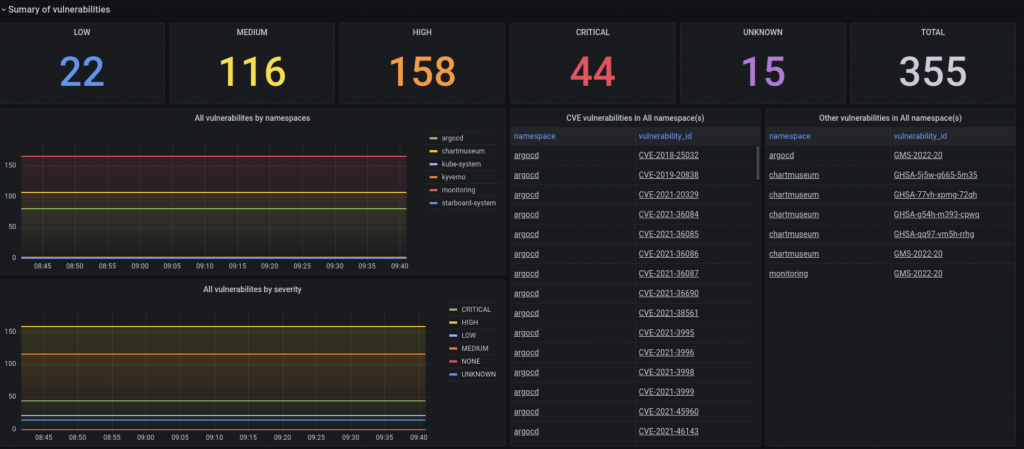
Grafana allows for easy access and querying of the Trivy-Operator’s metrics. There is already a comprehensive Grafana dashboard available for the Trivy-Operator that provides a good overview of the vulnerabilities in your cluster: Trivy-Operator-Dashboard
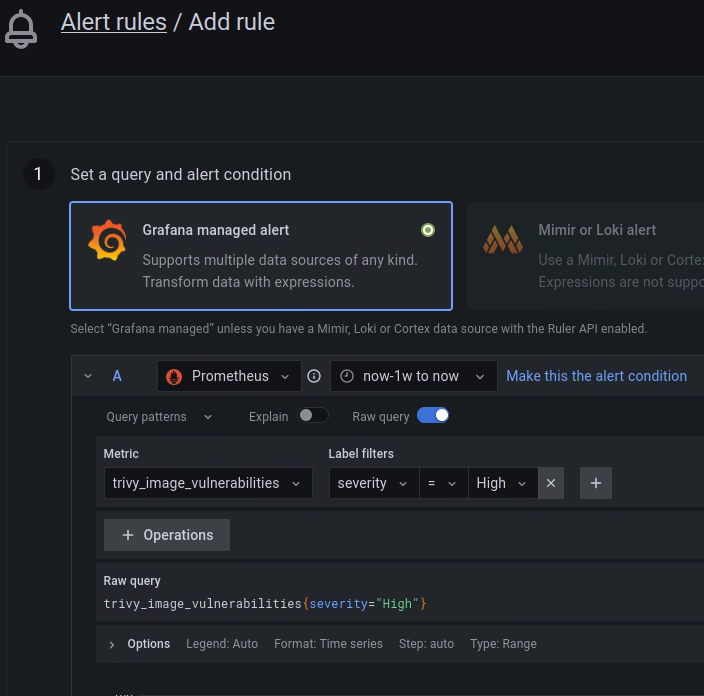
With Alertmanager you can create specific alarm rules for your environment that are tailored for your security incident process. You may want to configure alertmanager to create notifications (such as Slack, PagerDuty, or a custom webhook) for every new vulnerability that has a HIGH or CRITICALseverity level.
Summary
We all remember the days (and long nights) of the catastrophic log4j vulnerability short before christmas in 2021. Leveraging the Trivy-Operator for vulnerability scanning of your running containers can help to quickly identify what parts of your infrastructre are affected. You better be prepared when the next log4j knocks on your door! 🥸 I think the Trivy-Operator can play a key role for such scenarios by identifying which components are affected by security issues, such as the log4j vulnerability, in your infrastructure.
In my personal experience, it’s quite easy to get the Trivy-Operator running and doing its scans, but implementing the correct processes in order to remediate the findings of the Trivy-Operator and improve your overall Kubernetes cluster security is the real challenge!
1 Comment
Pingback: Latest technical articles & videos. - CertDepot